-
[React] list for map visualization data chart in ReactFrontend/react 2021. 11. 5. 18:06
나의 결론부터 보고 싶으면 22번으로 가면 된다.
1. 한국인이 만든 라이브러리

http://www.gisdeveloper.co.kr/?p=2332 https://www.npmjs.com/package/react-korea-map-visualization
react-korea-map-visualization
한국 지도 데이터 시각화를 위한 리액트 라이브러리 (개발 테스트)
www.npmjs.com
한국 맵용 시각화 라이브러리다.
topoJSON을 사용한다.
검색 하자마자 바로 나와서 쉽게 만들 수 있겠다는 생각으로 프로젝트를 다운
받아서 필요한 코드들을 복붙해서 만드니.
속도가 너무 느려 터져서.. 사용할 수 없겠더라.
하지만, 라이브러리에 있는 한국 topoJSON 파일이 추후 사용됐다.. 아주 감사.. 없었으면 성공 못했다.
2.대한민국 최신 행정구역(SHP) 다운로드 사이트

http://www.gisdeveloper.co.kr/?p=2332 http://www.gisdeveloper.co.kr/?p=2332
대한민국 최신 행정구역(SHP) 다운로드 – GIS Developer
www.gisdeveloper.co.kr
shp라는 파일을 처음 알게 되었다. 아직 이쪽으로 아는게 없어서 검색하고 시도해보다가 말았다.
활용하는 깃허브 : https://github.com/Charmatzis/react-leaflet-shapefile

https://codesandbox.io/s/add-zipped-shapefiles-to-a-react-leaflet-map-e7cr0?file=/src/Shapefile.jsx:627-633
3. 대한민국 행정구역(SVG) 다운로드

http://www.gisdeveloper.co.kr/?p=8555 http://www.gisdeveloper.co.kr/?p=8555
대한민국 행정구역(SVG) 다운로드 – GIS Developer
대한민국의 행정구역을 SVG(Scalable Vector Graphics) 형식으로 제공합니다. 연구 목적, 논문 저술 등의 학술 목적 또는 비영리의 개인적인 용도에 비용없이 사용하실 수 있습니다. 단, 반드시 출처는
www.gisdeveloper.co.kr
svp를 다운로드하니 html이 받아져서.. 일단 보류
4. react-simple-maps
https://github.com/zcreativelabs/react-simple-maps
GitHub - zcreativelabs/react-simple-maps: Beautiful React SVG maps with d3-geo and topojson using a declarative api.
Beautiful React SVG maps with d3-geo and topojson using a declarative api. - GitHub - zcreativelabs/react-simple-maps: Beautiful React SVG maps with d3-geo and topojson using a declarative api.
github.com
샘플 : https://www.react-simple-maps.io/examples/
topoJSON 형태의 위치 벡터값을 이용하는 라이브러리로 URL로 가져와서 뿌린다.
나는 파일을 불러와서 사용하는걸 찾고있었다. 살짝 보고 안되길래 바로 패스
5.react-svg-map
https://github.com/VictorCazanave/react-svg-map https://github.com/VictorCazanave/react-svg-map
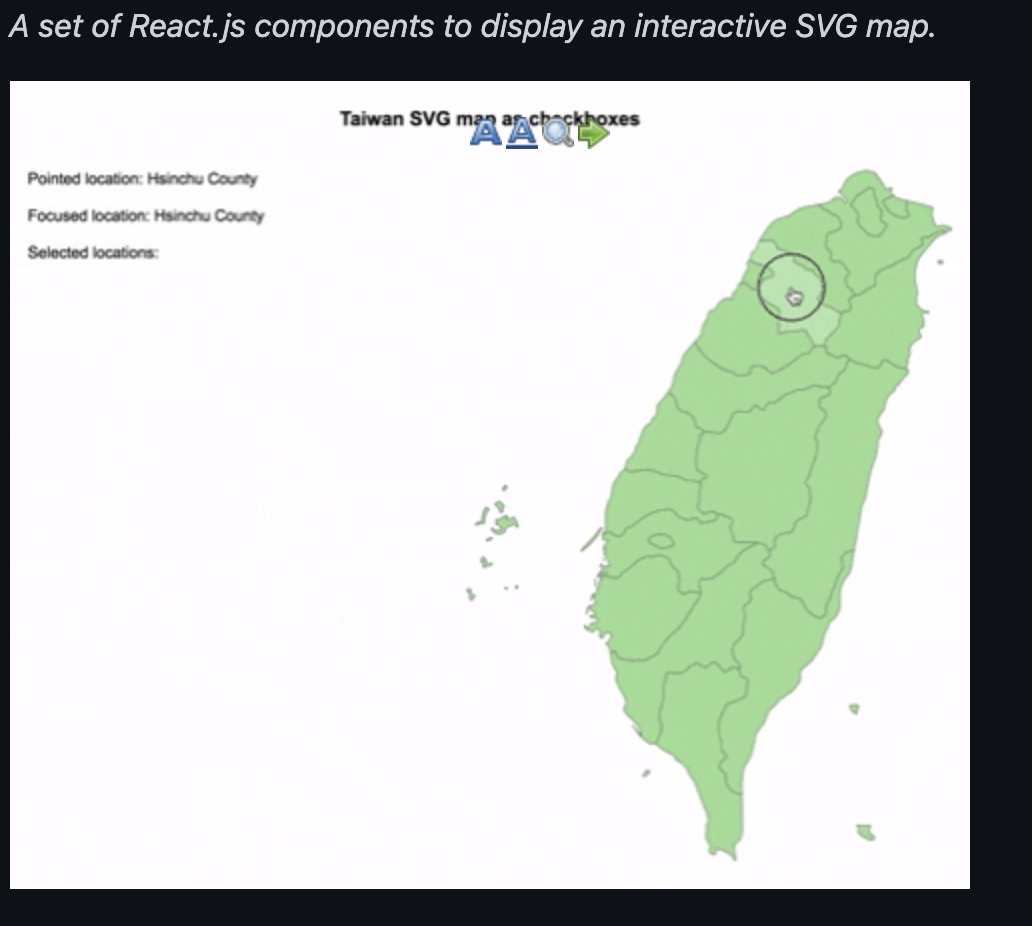
GitHub - VictorCazanave/react-svg-map: A set of React.js components to display an interactive SVG map
A set of React.js components to display an interactive SVG map - GitHub - VictorCazanave/react-svg-map: A set of React.js components to display an interactive SVG map
github.com
svg South Korea : https://www.npmjs.com/package/@svg-maps/south-korea
@svg-maps/south-korea에 미리 만들어진 패키지를 불러와서 만들어준다.
나의 경우 도시 하나만 필요해서 해당되지 않았다... 아쉽게도
geoJSON 파일이 있었는데 svg 파일로 변환해보려고 하다 포기 (변환 관련 깃허브 : https://github.com/w8r/geojson2svg)
근데 geoJSON은 어디서 구했더라.. 한국 geoJSON 파일을 구해서 원하는 지역만 떼내었다.
워낙에 삽질을 많이하다보니 가물가물..
어쩃든 이런씩
6. geoJSON to topoJSON
이 사이트가 정말정말 중요한 역할을 했다.
https://mygeodata.cloud/converter
Online GIS/CAD Data Converter | SHP, KML, KMZ, TAB, CSV, ...
MyGeodata Converter Online GIS / CAD Data Conversion and Transformation Tool Convert and transform both vector and raster geospatial data to various formats - online and for free. Including SHP, KML, KMZ, MIF/MID or TAB MapInfo File, GeoJSON, TopoJSON, CSV
mygeodata.cloud
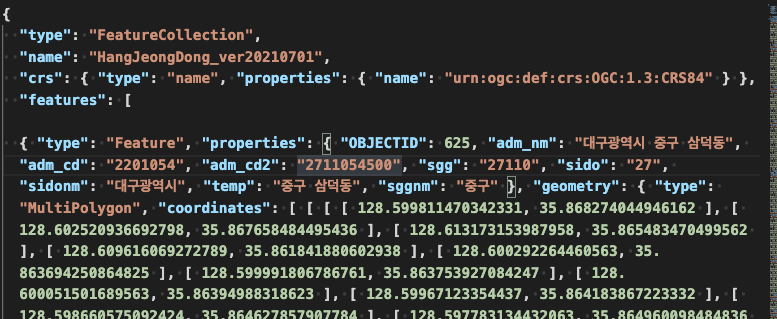
벡터 지도를 만드는 포맷은 크게 두 종류가 있다.
geoJSON과 topoJSON이다.
첨에 이런 것도 모르고 무작정하다보니 놓치는게 많았었다.
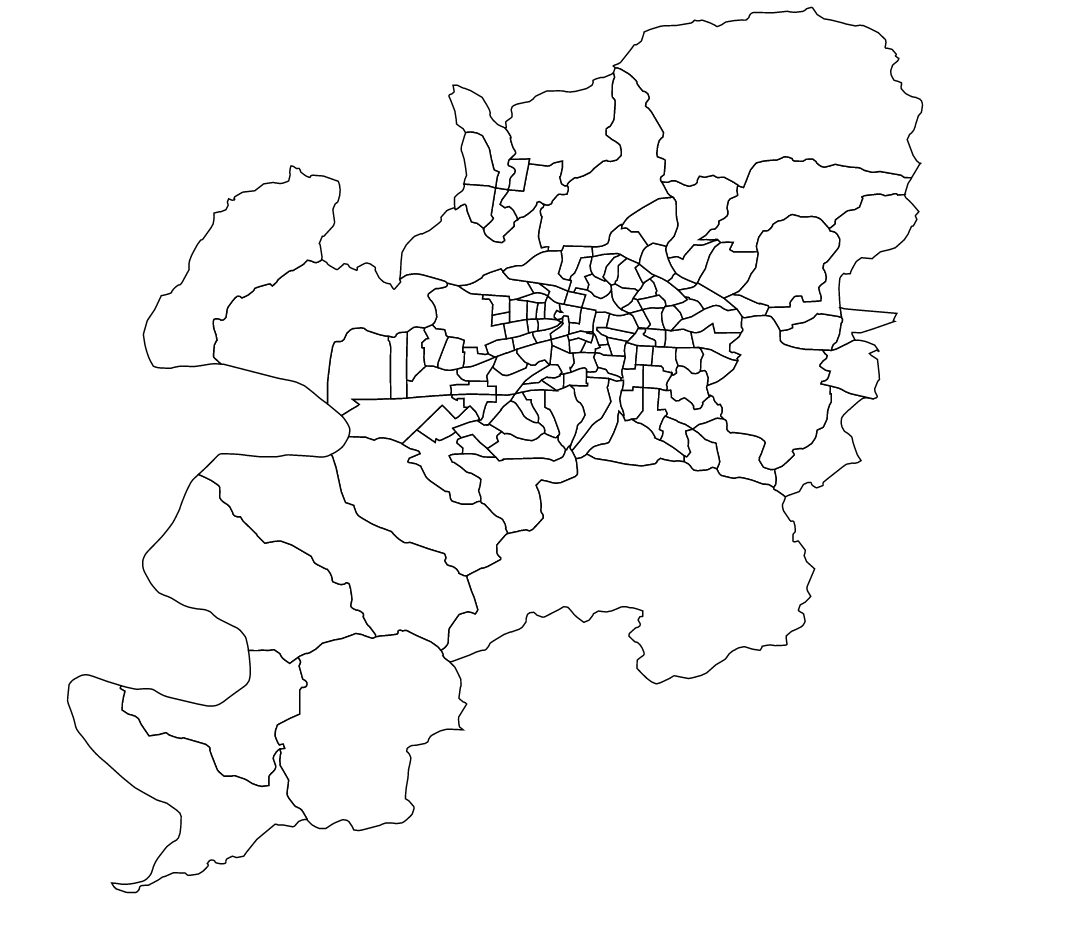
7. geoJSON to SVG

사이트에서 변환 결과 장면 https://products.aspose.app/gis/viewer/geojson-to-svg
GeoJSON to SVG online converter
Convert GeoJSON to SVG - Online GIS format converter, nothing to download, no registration, no watermark. Start converting for free!
products.aspose.app:443
변환 후 svg 파일을 바로 불러와 출력해보면 아래와 같다.
이걸로 개발하면 노가다로 하나하나 이벤트 다 처리 해야한다.. (주로 map을 사용한다더라)
후... 앞으로 정리해야 하는 것들이 이렇게 있다..
차근차근 해보자.

8. react-leaflet
https://github.com/PaulLeCam/react-leaflet
GitHub - PaulLeCam/react-leaflet: React components for Leaflet maps
React components for Leaflet maps. Contribute to PaulLeCam/react-leaflet development by creating an account on GitHub.
github.com
지도 그리는 라이브러리인데
https://doqtqu.tistory.com/181 여길 보고 따라해봤지만,
잘 안됐다. height가 0이라고 계속 canasRender에서 에러가 났다.
아래처럼 해줘도 여전해서 지지.
<MapContainer style={{ height: "100vh" }} center={position} zoom={this.state.zoom}>관련 예제 모음: https://codesandbox.io/examples/package/react-leaflet
9. 어떤 개발자분의 블로거(geoJSON을 이용해서 지도 만듦)
https://blog.hkwon.me/draw-korean-map-chart-with-geojson/
GeoJSON으로 대한민국 시군구읍면동 맵차트 그리기
최근에 진행하고 있는 사이드 프로젝트 중 하나에 전국/시/군/구/읍/면/동 별 맵차트를 그려야 할일이 생겼었다. 특정 지역의 분포도라던지 히트맵 정도를 지도에 보여줘야 하는 요구사항이었는
blog.hkwon.me
최후의 보루라 생각하고 스킵.
10. TOAST UI 차트 오픈 소스 라이브러리
https://www.wenyanet.com/opensource/ko/60633de29cb5f433462a581b.html
React 용 토스트 UI 차트 - wenyanet
Created at: 2019-01-30 09:17:44 React 용 TOAST UI 차트 TOAST UI Chart를 래핑 한 React 컴포넌트 입니다. 🚩 목차 오픈 소스 사용 통계 수집 TOAST UI Chart의 React Wrapper는 TOAST UI Chart가 전 세계적으로 얼마나 널리
www.wenyanet.com
https://github.com/nhn/toast-ui.react-chart
GitHub - nhn/toast-ui.react-chart: Toast UI Chart for React
Toast UI Chart for React. Contribute to nhn/toast-ui.react-chart development by creating an account on GitHub.
github.com
https://github.com/nhn/tui.chart#-features
GitHub - nhn/tui.chart: 🍞📊 Beautiful chart for data visualization.
🍞📊 Beautiful chart for data visualization. Contribute to nhn/tui.chart development by creating an account on GitHub.
github.com
https://ui.toast.com/tui-chart
TOAST UI :: Make Your Web Delicious!
The TOAST UI Is Free Open-source JavaScript UI Libraries Maintained By NHN.
ui.toast.com
일반 차트를 만들때 사용하면 유용할 것 같아보인다.
11. react-google-charts-geo-chart
코드샌드박스 예제링크
https://codesandbox.io/s/ll9r7wxkmq?file=/src/index.js
react-google-charts-geo-chart - CodeSandbox
react-google-charts-geo-chart by rakannimer using react, react-dom, react-google-charts, react-scripts
codesandbox.io
자세히 알아보진 않았다.
12. react-chartjs-2
https://github.com/reactchartjs/react-chartjs-2
GitHub - reactchartjs/react-chartjs-2: 📊📈 React components for Chart.js, the most popular charting library
📊📈 React components for Chart.js, the most popular charting library - GitHub - reactchartjs/react-chartjs-2: 📊📈 React components for Chart.js, the most popular charting library
github.com
chartjs 라이브러리는 워낙 유명하니 설명은 않겠다.
geo차트는 보이지 않아서 패스
13. 리액트 차트 라이브러리 모음 링크 (어느 개발자 블로그)
[React] 리액트 그래프/차트 라이브러리 모음
기업협업 프로젝트에서 다양한 차트 라이브러리를 사용해야 해서 직접 사용해 본 라이브러리나 리액트 개발자들 사이에서 유명한 라이브러리를 모아 보았다. https://nivo.rocksNivo.rocks커스텀 끝판
velog.io
14. nivo.rocks
Components
Supercharged React dataviz components, built on top of d3js.
nivo.rocks

https://coronaboard.kr/ UI가 취향에 맞으면 사용하기 좋아보인다.
15. 코로나현황 사이트
코로나19(COVID-19) 실시간 상황판
코로나19(신종 코로나바이러스)에 관한 세계 각 국가들의 통계 및 뉴스 등을 취합하여 실시간 정보를 제공합니다.
coronaboard.kr
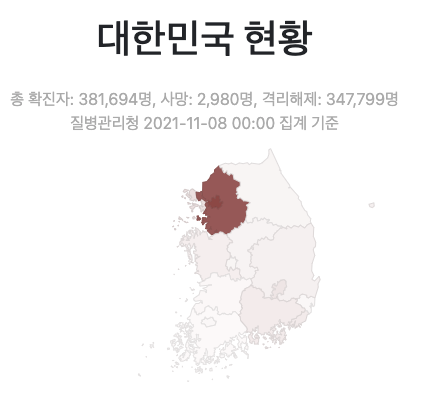
https://coronaboard.kr/ 잘만들었네...
저걸 따라 만든 이들
1일 해커톤 프로젝트 "covidLive" 후기
패스트 캠퍼스 프론트엔드 스쿨에서 진행했던 1일(12h)해커톤 covidLive의 후기입니다. 프로젝트의 시작 / 주제 정하기 짧은 시간동안 진행하는 해커톤을 진행하려고 조를 짜고 팀원들과 회의를 진
velog.io
16. react-static-google-map
https://github.com/bondz/react-static-google-map
GitHub - bondz/react-static-google-map: Load Google Static images in your react app
Load Google Static images in your react app. Contribute to bondz/react-static-google-map development by creating an account on GitHub.
github.com
https://github.com/google-map-react/google-map-react
GitHub - google-map-react/google-map-react: Google map library for react that allows rendering components as markers
Google map library for react that allows rendering components as markers :tada: - GitHub - google-map-react/google-map-react: Google map library for react that allows rendering components as markers
github.com
https://after-newmoon.tistory.com/m/80
google maps React로 시작하기✨
(2020.12.01 수정) 저번 개인 프로젝트였던 Place Now를 React로 수정하는 과정을 기록하려 한다. 아직까지 책과 강의를 보면서 React가 이런 거구나 하고 배우기 시작한 단계이기 때문에 많이 헤매기도
after-newmoon.tistory.com
구글에서 지원해주나? 싶어서 구글 API 계정 등록에 지불수단까지 등록했는데,
알고보니 구글 분석 도구... API활용
삽질함.!;
아래 링크는 구글 차트 라이브러리
https://react-google-charts.com/
17. data-visualization-experiments
https://github.com/sujinleeme/data-visualization-experiments
GitHub - sujinleeme/data-visualization-experiments: Various Data Visualization Works with React, d3.js
Various Data Visualization Works with React, d3.js - GitHub - sujinleeme/data-visualization-experiments: Various Data Visualization Works with React, d3.js
github.com

https://life-of-panda.tistory.com/11 어떤 개발자분이 만들었는데, d3 라이브러리 이용.
내가 원하던 UI가 아니라 그것도 보류.
18. 해외 개발자 튜토리얼
https://hackernoon.com/mapping-tutorial-combining-victory-charts-and-react-simple-maps-4e839d803865
Mapping Tutorial: Combining Victory Charts and React-Simple-Maps | Hacker Noon
hackernoon.com
한국맵도 아니고 해서, 보류
https://medium.com/react-courses/world-map-chart-with-react-d3-with-ts-468b05f35404
https://levelup.gitconnected.com/react-d3-rendering-a-map-5e006b2f4895
19. QGIS (지도 레이어 뽑아주는 도구)
QGIS 프로젝트에 오신 것을 환영합니다!
여러분의 GIS 작업에 QGIS를 사용해 보세요.
qgis.org
사용 설명 블로그: https://blog.naver.com/kum2146/222162639725
이 툴도 최후의 보루로 구별 레이어 벡터를 못구할경우 사용하려고 했다.
일단 설치만 해둠.
20. d3 & geoJson을 이용한 한국 지도 만들기 예제 블로그
https://myhappyman.tistory.com/97
Javascript - d3와 geoJson파일을 활용한 웹에서 한국 지도 만들기
예전에 포스팅한 amchart에서 svg로 표현된 svg파일을 가져와서 svg코드를 수정거나 CSS 변경으로 적용했던 부분을 많이 보러 오시는걸 보고 한국지도를 찾는분들이 많이 계시는걸 알게 되었습니다.
myhappyman.tistory.com
21. react-d3-map
https://github.com/react-d3/react-d3-map
GitHub - react-d3/react-d3-map: react-d3 interactive map
react-d3 interactive map. Contribute to react-d3/react-d3-map development by creating an account on GitHub.
github.com
애석하게도 typescript를 지원하지 않더라..
22. react-typescript-datamaps
https://github.com/orenef/react-typescript-datamaps
GitHub - orenef/react-typescript-datamaps: react wrapper component for the 'datamaps' library (Interactive maps for data visuali
react wrapper component for the 'datamaps' library (Interactive maps for data visualizations). Out of the box it includes advance arc-attack-plugin and demo mode. - GitHub - orenef/react-ty...
github.com
드디어 만난 나의 구세주!
데모가 총 2가지가 있는데,
DataMapsWrapper 예제를 보면 된다.
https://codesandbox.io/s/react-typescript-datamaps-lgzbz
react-typescript-datamaps - CodeSandbox
react wrapper component for the datamaps library - Interactive maps for data visualizations.
codesandbox.io
인도인이 만든건지, 인도 지도 위주로 나온다.
여기에서 topoJSON파일을 불러와 demoProps를 수정하면 너무 쉽게 만들 수 있다.
여기서 해결..!

23. geoJSON과 topoJSON 정리?
https://life-of-panda.tistory.com/11
[데이터 시각화] GeoJSON과 TopoJSON
데이터를 지도 형태로 시각화할 때 GeoJSON이나 TopoJSON 데이터를 활용할 수 있다. 1. GeoJSON www.geojson.org 에 따르면 GeoJSON은 다양한 지리적 데이터 구조를 인코딩하는 형식이다. GeoJSON은 Point, LineS..
life-of-panda.tistory.com
'Frontend > react' 카테고리의 다른 글